01 / The first-week growth report
The baseline and the result
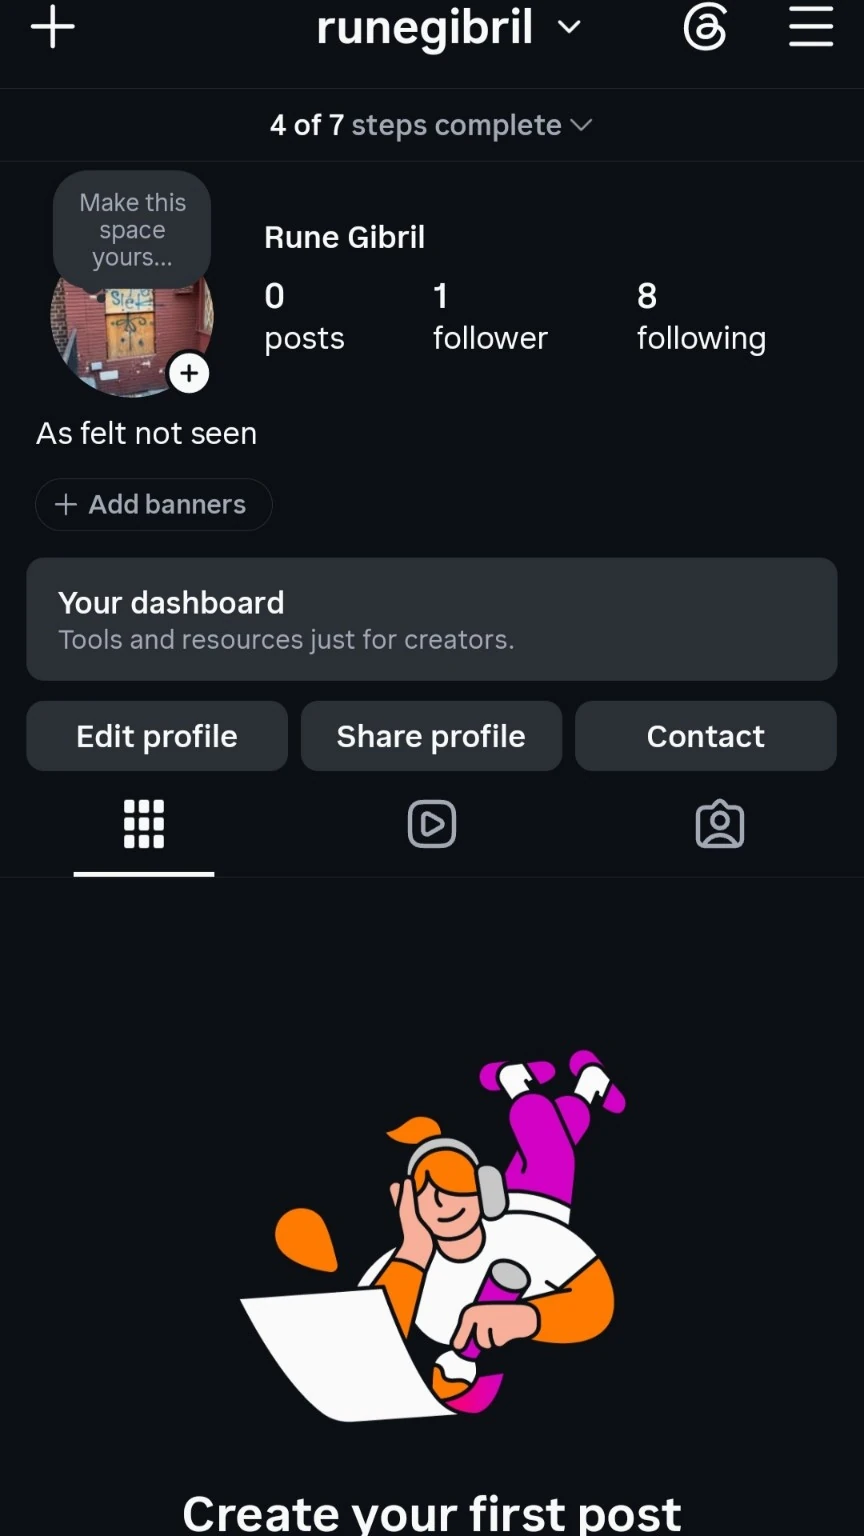
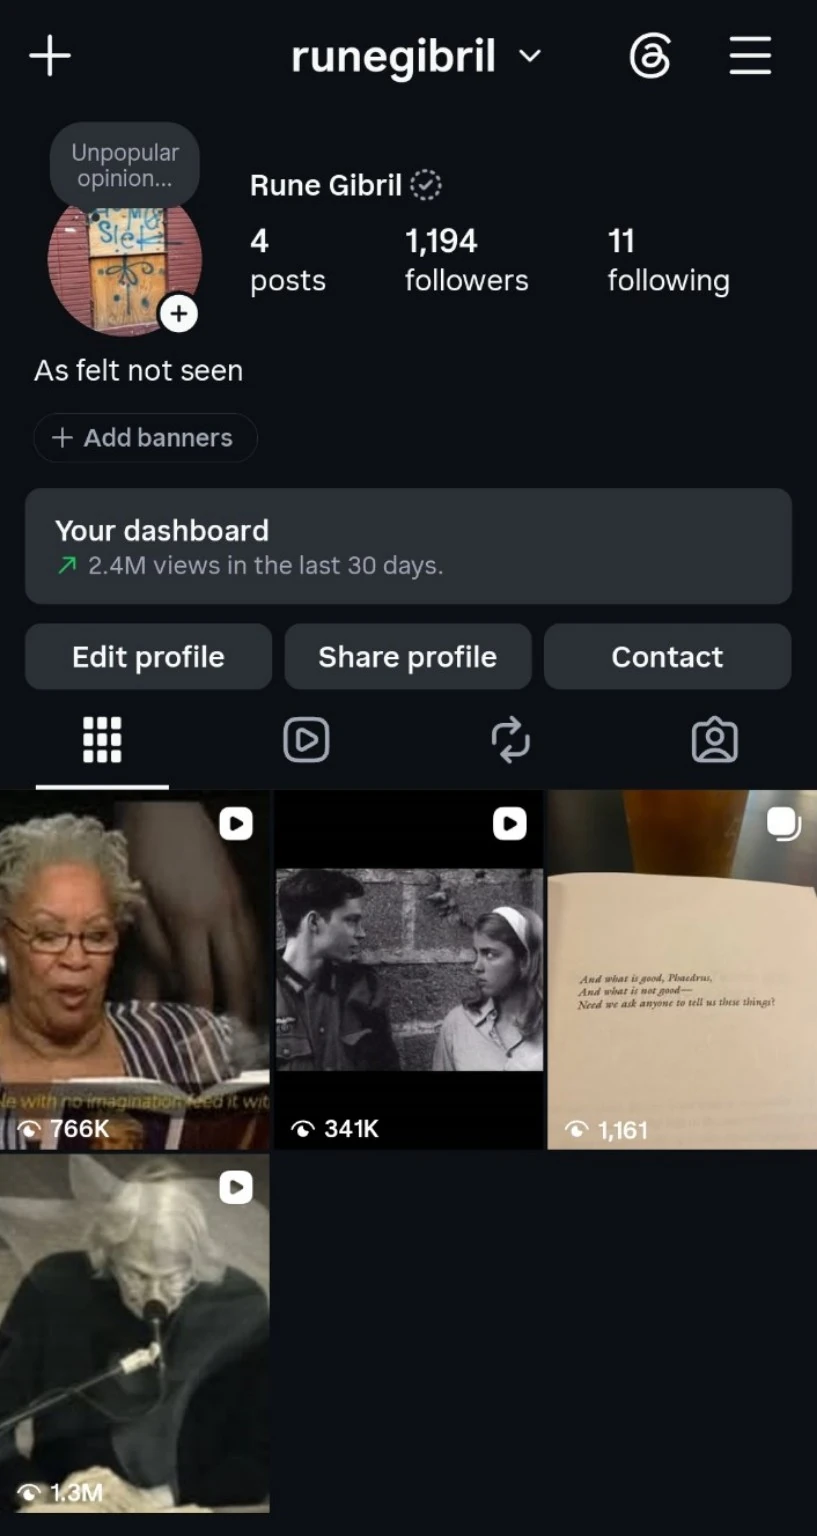
The original profile shows zero posts and one follower. The profile captured on 27 October shows four visible posts and 1,194 followers. Across those two checkpoints, the account gained a net 1,193 followers.
That comparison is useful because it establishes the small starting point. The visible post count describes the profile at that moment; it is not the number of all experiments conducted during the week. Trial Reels can be outside the main profile grid.
02 / The first-week growth report
Read the dashboard with its filter
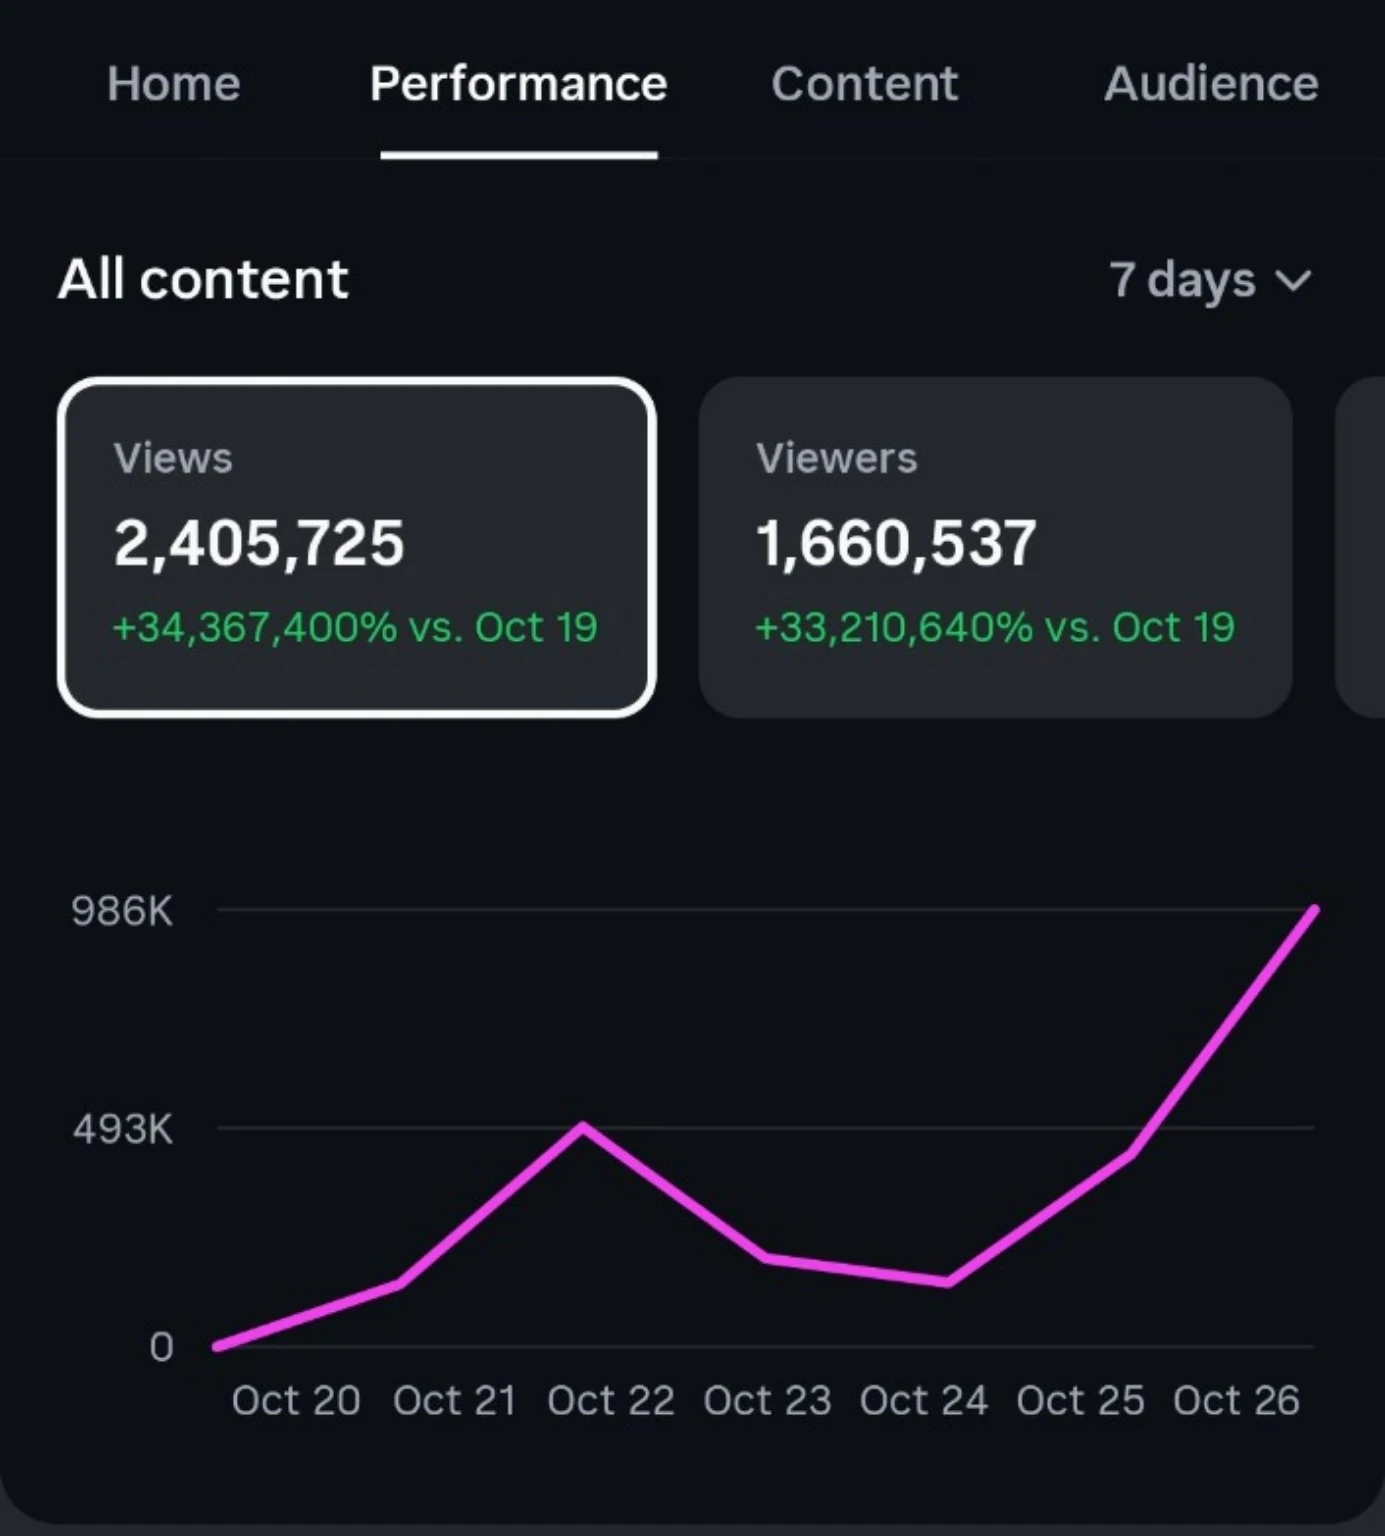
The archived seven-day performance image shows 2,405,725 views and 1,660,537 viewers. Its chart labels run from 20 October through 26 October. The first publication happened on 21 October, and the operating-week report was assembled on 27 October.
We preserve the dashboard as it was captured instead of changing its label to imply a custom 21–27 October extraction. Views can include repeat viewing; viewers is the native dashboard term. It should not be renamed reach to make it match a different API field.
03 / The first-week growth report
A launch followed by experiments
The first week included eight Reel publications or tests: four main-feed Reels and four trial experiments, according to the delivery record. Two main-feed Reels performed strongly, and one trial became a standout and was shared to the main feed.
The public collection selects the strongest approved examples. It is not a complete test log, an average result or a claim that every publication performed equally. The first Reel story and the Trial Reels report explain those two parts of the week in more detail.
04 / The first-week growth report
How the later snapshot differs
By 31 October, a separate native dashboard showed 1,575 followers and 3,151,603 account views on a 30-day filter. Those figures belong to the later snapshot and appear in the complete case study. They are not substituted into the first-week report.
Keeping each checkpoint intact makes the trajectory understandable. It also prevents a common reporting mistake: presenting a later lifetime Reel total or rolling account total as if it had been achieved inside the first seven days.
05 / The first-week growth report
What we would carry into the next week
The account had earned discovery and a meaningful initial following. The next work was to understand which topics and formats could sustain that interest, rather than increasing volume solely because one Reel had broken out.
For an author platform, continued attention to the account's own writing and point of view will matter. This report establishes early distribution and follower growth. It does not turn those followers into confirmed future book buyers.